The Gendered Politics of Congressional Elections

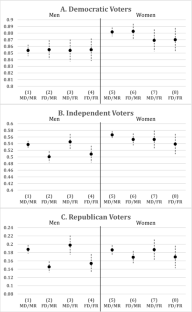
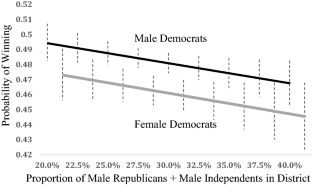
Are female candidates less likely than male candidates to attract votes or win elections? We conduct a large-n longitudinal analysis employing survey and observational data from every two-party congressional race over a 12-year period (2006–2018) and connect individual-level theory and evidence with aggregate-level results. We demonstrate that candidate gender significantly influences congressional vote-choice and election outcomes. Holding other variables constant, we show that male Republican and male independent voters are significantly less likely to vote for female Democratic candidates, but do not assess a similar penalty on female Republican candidates. Perceived ideological distance does not explain the lack of support for female Democrats—however, variation in candidate quality does: Female Democratic candidates can attract the support of male Republican and male independent voters when they have a qualifications advantage, but are penalized when they are merely “as qualified.” At the aggregate-level, female Democratic candidates with a qualifications advantage are as likely as males to win elections; but are significantly less likely than males to win when qualifications are held constant. The proportion of male Republicans and male independents in a district determines the extent of the penalty, with women’s electoral prospects declining as this proportion increases. Women can win, but they need to be highly qualified and strategic about the races in which they emerge. These findings contribute to our understanding of the micro- and macro-level factors that shape women’s electoral fortunes; and advance the goal of representational equality by helping candidates and campaigns concentrate their efforts on the most winnable voters and districts.
This is a preview of subscription content, log in via an institution to check access.
Access this article
Subscribe and save
Springer+ Basic
€32.70 /Month
- Get 10 units per month
- Download Article/Chapter or eBook
- 1 Unit = 1 Article or 1 Chapter
- Cancel anytime
Buy Now
Price includes VAT (France)
Instant access to the full article PDF.
Rent this article via DeepDyve
When Women Run, Voters Will Follow (Sometimes): Examining the Mobilizing Effect of Female Candidates in the 2014 and 2018 Midterm Elections
Article 07 January 2022
Ideology and Gender in U.S. House Elections
Article 28 September 2018
Voting for women in recent Canadian elections
Article 05 February 2024
Notes
Previous research suggests that women voters can also be sexist (Cassese and Barnes 2018). For instance, white women may adopt sexist beliefs in order to gain acceptance, privilege, and protection from men. Our argument is not that women voters will not be sexist at all, but rather, that they are less likely than men to be sexist due to personal experiences with discrimination and self-interest in gender egalitarian policies.
To be clear, our argument about women’s quality advantage stems not from any kind of “natural superiority” of women candidates. Rather, our theory is rooted in differential competitive pressures faced by male and female candidates, and gendered self-selection.
Ansolabehere (2010a, b, 2012); Ansolabehere and Schaffner (2013, 2017); Shaffner and Ansolabehere (2015); Shaffner et al. (2019).
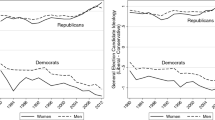
It is worth noting that this period covers times of good and bad fortune for both parties. Democrats dominated the elections of 2006, 2008, 2012 and 2018; but Republicans fared better than Democrats in 2010, 2014 and 2016. Only for four years (2008–2010 and 2016–2018) was there unified party control of government. Across the period under study, neither party had a distinct advantage.
Uncontested races where the incumbent ran unopposed, and races where two co-partisans ran against each other (e.g. California’s “top-two” primary system occasionally produces general elections with either two Democrats or two Republicans running) are excluded from the analysis.
Online Appendix A provides the summary statistics for all of the variables included in our individual-level models.
We omit respondents who voted for third-party candidates, since we are interested in the two-party vote.
Choosing to code the dependent variable in the direction of Democrats is arbitrary as the two-party vote share adds to 100. Changing the dependent variable to the Republican’s vote-share simply flips the sign of the coefficients in the model, but does not alter the coefficient’s size, significance or any of the other model statistics except for the intercept.
Male (0) or Female (1).
For ease of interpretation in our interactive models, we collapse the seven-point partisanship variable into three categories: − 1 = Strong/Weak/Lean Democrat, 0 = Pure Independent, 1 = Strong/Weak/Lean Republican. Our results remain unchanged if we include partisan leaners as independents.
White (1) or non-white (0).
Married (1) or not married (0).
Employed full-time (1) or not (0).
College-educated (1) or not (0).
Extremely Liberal (1) to Extremely Conservative (7).
To see whether the gap in relative spending or relative experience contributes more to female Democrats’ disadvantage, we estimate two separate models: one with only relative spending, and one with only relative experience. The female Democratic candidate coefficient emerges as negative and statistically significant in both the models: ß = − 0.13 (p < 0.001) in the model with only relative spending and ß = − 0.05 (p < 0.10) in the model with only relative experience. Although the two variables are significantly correlated (r = 0.74, p < 0.001), they each contribute unique variance when they are included together as shown in Models 2–4 in Table 1.
It is notable that the number of cases drops significantly (from 195 K respondents to a little over 120 K) when the perceived ideological distance measure is included. This is because a large portion of respondents could not place the Democratic candidate on an ideological scale. To evaluate whether these omitted cases were introducing bias, we ran Model 3 without the perceived distance variable. Our results are unchanged when we omit perceived distance: MR + MI voters are significantly less supportive of female than male Democratic candidates. Online Appendix B reports this analysis in greater detail.
An alternative explanation for our findings is that female Democrats are penalized for being more racially diverse than female Republicans. To fully answer whether this question, we would need to know the racial identity of every candidate, which we do not have. As a preliminary test of the racism hypothesis, we evaluate whether white voters are more punitive towards female Democrats than the full sample of voters, but we find that this is not the case. See Online Appendix C for the full analysis.
For example, scholars of micro- and macro-level partisanship debate about the nature and stability of partisan attachments: Green et al. (2002); Erikson et al. (2002)
Uncontested races where the incumbent ran unopposed and races where two co-partisans ran against each other are excluded from the analysis.
Online Appendix D provides the summary statistics for all of the variables included in our models.
References
- Abramowitz, A. A., & Webster, S. (2016). The rise of negative partisanship and the nationalization of U.S. elections in the 21st century. Electoral Studies,41, 12–22. ArticleGoogle Scholar
- Alexander, D., & Anderson, K. (1993). Gender as a factor in the attribution of leader-ship traits. Political Research Quarterly,46(3), 527–545. ArticleGoogle Scholar
- Ambrosius, M. M., & Welch, S. (1984). Women and politics at the grassroots: Women candidates for state office in three states, 1950–1978. Social Science Journal,21(1), 29–42. Google Scholar
- Ansolabehere, S. (2010a). CCES common content, 2006. https://doi.org/10.7910/DVN/Q8HC9N, Harvard Dataverse, V4, UNF:5:Zz4+e5bz7lzeLOjQCUk+lw== [fileUNF].
- Ansolabehere, S. (2010b). CCES, common content, 2008. https://doi.org/10.7910/DVN/YUYIVB, Harvard Dataverse, V6, UNF:5:7eeaUMPVCcKDNxK6/kd37w== [fileUNF].
- Ansolabehere, S. (2012). CCES common content, 2010. https://doi.org/10.7910/DVN/VKKRWA, Harvard Dataverse, V3.
- Ansolabehere, S., & Schaffner, B. (2013). CCES common content, 2012. https://doi.org/10.7910/DVN/HQEVPK. Harvard Dataverse, V9, UNF:5:Eg5SQysFZaPiXc8tEbmmRA== [fileUNF].
- Ansolabehere, S., & Schaffner, B. F. (2017). CCES common content, 2016. https://doi.org/10.7910/DVN/GDF6Z0, Harvard Dataverse, V4, UNF:6:WhtR8dNtMzReHC295hA4cg== [fileUNF].
- Anzia, S. F., & Berry, C. R. (2011). The Jackie (and Jill) Robinson effect: Why do congresswomen outperform congressmen? American Journal of Political Science,55(3), 478–493. ArticleGoogle Scholar
- Arzheimer, K. (2009). Contextual factors and the extreme right vote in Western Europe, 1980–2002. American Journal of Political Science,53(2), 259–275. ArticleGoogle Scholar
- Arzheimer, K., & Carter, E. (2006). Political opportunity structures and right-wing extremist party success. European Journal of Political Research,45(3), 419–443. ArticleGoogle Scholar
- Ashworth, S., Berry. C. R., & de Mesquita, E. B. (2020). Sources of women’s underrepresentation in U.S. Politics: A model of election aversion and voter discrimination. Unpublished manuscript.
- Barnes, T. D., Branton, R. P., & Cassese, E. C. (2017). A reexamination of women’s electoral success in open seat elections: The conditioning effect of electoral competition. Journal of Women, Politics and Policy,38(3), 298–317. ArticleGoogle Scholar
- Basinger, S. J., & Lavine, H. (2005). Ambivalence, information, and electoral choice. American Political Science Review,99(1), 169–184. ArticleGoogle Scholar
- Bauer, N. M. (2015). Emotional, sensitive, and unfit for office? Gender stereotype activation and support female candidates. Political Psychology,36(6), 691–708. ArticleGoogle Scholar
- Becker, J. C., & Swim, J. K. (2012). Reducing endorsement of benevolent and modern sexist beliefs: Differential Effects of addressing harm versus pervasiveness of benevolent sexism. Social Psychology,43(3), 127–137. ArticleGoogle Scholar
- Beckwith, K. (2000). Beyond compare? Women’s movements in comparative perspective. European Journal of Political Research,37(4), 431–468. Google Scholar
- Berch, N. (2004). Women incumbents, elite bias and voter response in the 1996 and 1998 U.S. house election. Women & Politics,26(1), 21–33. ArticleGoogle Scholar
- Bernstein, R. A. (1986). Why are there so few women in the house? Western Political Quarterly,39(1), 155–164. ArticleGoogle Scholar
- Black, J. H., & Erickson, L. (2000). Similarity, compensation or difference? A comparison of female and male office-seekers. Women & Politics,21(4), 1–38. ArticleGoogle Scholar
- Bolsen, T., & Thornton, J. R. (2014). Overlapping confidence intervals and null hypothesis testing. The Experimental Political Scientist,4(1), 12–16. Google Scholar
- Bos, A. L., Schneider, M. C., & Utz, B. L. (2018). Navigating the political labyrinth: Gender stereotypes and prejudice in US elections. In C. Travis & J. White (Eds.), APA handbook of the psychology of women. Washington, DC: American Psychological Association. Google Scholar
- Burns, N., Schlozman, K. L., & Verba, S. (2001). The private roots of public action: Gender, equality and political representation. Cambridge: Harvard University Press. Google Scholar
- Burrell, B. (1985). Women’s and men’s campaigns for the U.S. house of representatives, 1972–1982. A finance gap? American Politics Research,13(3), 251–272. ArticleGoogle Scholar
- Burrell, B. (1994). A woman’s place is in the house: Campaigning for congress in the feminist era. Ann Arbor: University of Michigan Press. BookGoogle Scholar
- Burrell, B. (2003). Money and women’s candidacies for public office. In S. J. Carroll (Ed.), Women and American politics: New questions, new directions. Oxford: Oxford University Press. Google Scholar
- Campbell, A., Converse, P., Miller, W., & Stokes, D. (1960). The American voter. Hoboken, NJ: Wiley. Google Scholar
- Carey, T. E., & Lizotte, M. K. (2019). Political experience and the intersection between race and gender. Politics, Groups and Identities,7(2), 243–266. ArticleGoogle Scholar
- Cassese, E. C., & Barnes, T. D. (2018). Reconciling sexism and women's support for republican candidates: A look at gender, class, and whiteness in the 2012 and 2016 presidential races. Political Behavior,41(3), 1–24. Google Scholar
- Cassese, E. C., & Holman, M. R. (2019). Playing the woman card: Ambivalent sexism in the 2016 US presidential race. Political Psychology,40(1), 55–74. ArticleGoogle Scholar
- Caul, M. (2001). Political parties and the adoption of candidate gender quotas: A cross-national analysis. Journal of Politics,63(4), 1214–1229. ArticleGoogle Scholar
- CAWP. (2019). Women general election candidates for U.S. congress and statewide elected executive. Retrieved March 10, 2020, from https://cawp.rutgers.edu/facts/elections/past_candidates.
- Converse, P. E. (1964). Ideology and Discontent. Washington, DC: Free Press. Google Scholar
- Cooperman, R., & Crowder-Meyer, M. (2018). A run for their money: republican women’s hard road to campaign funding. In M. Och & S. L. Shames (Eds.), The right women: Republican party activists, candidates and legislators. Santa Barbara: ABC-CLIO. Google Scholar
- Crowder-Meyer, M., & Lauderdale, B. E. (2014). A partisan gap in the supply of female potential candidates in the United States. Research & Politics,1(1), 1–7. ArticleGoogle Scholar
- Darcy, R., & Schramm, S. S. (1997). When women run against men. Public Opinion Quarterly,41(1), 1–12. ArticleGoogle Scholar
- Darcy, R., Welch, S., & Clark, J. (1994). Women, elections and representation. Lincoln: University of Nebraska Press. Google Scholar
- Deckman, M. (2016). Tea party women: Mama grizzlies, grassroots leaders and the changing face of the American right. New York: New York University Press. BookGoogle Scholar
- Ditonto, T. (2019). Direct and indirect effects of prejudice: Sexism, information, and voting behavior in political campaigns. Politics, Groups and Identities,7(3), 590–609. ArticleGoogle Scholar
- Dittmar, K. (2019). By the numbers. U.S. house candidates, nominees, and winners, by party 1990–2019 CAWP. Retrieved March 10, 2020, from https://womenrun.rutgers.edu/by-the-numbers/.
- Dolan, K., & Sanbonmatsu, K. (2009). Gender stereotypes and attitudes towards gender balance in government. American Politics Research,37(3), 409–428. ArticleGoogle Scholar
- Eagly, A. H., & Karau, S. J. (2002). Role congruity theory of prejudice toward female leaders. Psychological Review,109(3), 573–598. ArticleGoogle Scholar
- Economist/YouGov. (2018). Economist/YouGov Poll, April 22–24, 2018, 1500 U.S. adults. Retrieved March 10, 2020, from https://d25d2506sfb94s.cloudfront.net/cumulus_uploads/document/a849k68e2i/econTabReport.pdf.
- Erikson, R. S., MacKuen, M. B., & Stimson, J. A. (2002). The macro polity. New York: Cambridge University Press. Google Scholar
- Evans, J. A. J. (2005). The dynamics of social change in radical right-wing populist party support. Comparative European Politics,3(1), 76–101. ArticleGoogle Scholar
- Fox, R. L., & Lawless, J. L. (2005). To run or not to run for office: Explaining nascent political ambition. American Journal of Political Science,49(3), 642–659. ArticleGoogle Scholar
- Fox, R. L., & Smith, E. R. A. N. (1998). The role of candidate sex in voter decision-making. Political Psychology,19(2), 405–419. ArticleGoogle Scholar
- Fulton, S. A. (2012). Running backwards and in high heels: The gendered quality gap and incumbent electoral success. Political Science Quarterly,65(2), 303–314. Google Scholar
- Fulton, S. A. (2014). When gender matters: Macro-dynamics and micro-mechanisms. Political Behavior,36(3), 605–630. ArticleGoogle Scholar
- Fulton, S. A., Maestas, C. D., Sandy Maisel, L., & Stone, W. J. (2006). The sense of a woman: Gender, ambition and the decision to run for congress. Political Research Quarterly,59(2), 235–248. ArticleGoogle Scholar
- Fulton, S. A., & Ondercin, H. L. (2013). Does sex encourage commitment? The impact of candidate choices on the time-to-decision. Political Behavior,35(4), 665–686. ArticleGoogle Scholar
- Givens, T. E. (2004). The radical right gender gap. Comparative Political Studies,37(1), 30–54. ArticleGoogle Scholar
- Green, D., Palmquist, B., & Schickler, E. (2002). Partisan hearts and minds: Political parties and the social identities of voters. New Haven, CT: Yale University Press. Google Scholar
- Green, D. P., & Krasno, J. S. (1988). Salvation for the spendthrift incumbent: Reestimating the effects of campaign spending in house elections. American Journal of Political Science,32(4), 884–907. ArticleGoogle Scholar
- Hennings, V. M., & Urbatsch, R. (2015). There can be only one (woman on the ticket): Gender in candidate nominations. Political Behavior,37(3), 749–766. ArticleGoogle Scholar
- Holman, M. R., Merolla, J. L., & Zechmeister, E. J. (2016). Terrorist threat, male stereotypes and candidate evaluation. Political Research Quarterly,69(1), 134–147. ArticleGoogle Scholar
- Huddy, L., & Terkildsen, N. (1993a). The consequences of gender stereotypes of women candidates at different levels and types of office. Political Research Quarterly,46(3), 503–526. ArticleGoogle Scholar
- Huddy, L., & Terkildsen, N. (1993b). Gender stereotypes and the perception of male and female candidates. American Journal of Political Science,37(1), 119–147. ArticleGoogle Scholar
- Hughes, M. M., & Paxon, P. (2007). Familiar theories from a new perspective: The implications of a longitudinal approach to women in politics research. Politics & Gender,3(3), 370–378. Google Scholar
- Jackman, M. R. (1994). The velvet glove: Paternalism and conflict in gender, class, and race relations. Berkeley: University of California Press. BookGoogle Scholar
- Jacobson, G. C., & Kernell, S. (1983). Strategy and choice in congressional elections. New Haven, NJ: Yale University Press. Google Scholar
- Jenkins, S. (2007). A woman’s work is never done? Fund-raising perception and effort among female state legislative candidates. Political Research Quarterly,60(2), 230–239. ArticleGoogle Scholar
- Kahn, K. F. (1994). Does gender make a difference? An experimental examination of sex stereotypes and press patterns in statewide campaigns. American Journal of Political Science,38(1), 162–195. ArticleGoogle Scholar
- Kahn, K. F. (1996). The political consequence of being a woman: How stereotypes influence the conduct and consequences of political campaigns. New York: Columbia University Press. Google Scholar
- Koch, J. W. (2000). Do citizens apply gender stereotypes to infer candidates’ ideological orientations? Journal of Politics,62(2), 414–429. ArticleGoogle Scholar
- Koch, J. W. (2002). Gender stereotypes and citizens’ impressions of house candidates’ ideological orientations. American Journal of Political Science,46(2), 453–462. ArticleGoogle Scholar
- Lawless, J. L. (2015). Female candidates and legislators. Annual Review of Political Science,18(1), 349–366. ArticleGoogle Scholar
- Lawless, J. L., & Pearson, K. (2008). The primary reason for women's underrepresentation? Reevaluating the conventional wisdom. The Journal of Politics,70(1), 67–82. ArticleGoogle Scholar
- Lazarus, J., & Steigerwalt, A. (2018). Gendered vulnerability: How women work harder to stay in office. Ann Arbor: University of Michigan Press. BookGoogle Scholar
- Lenz, G. (2012). Follow the leader? How voters respond to politicians’ policies and performance. Chicago, IL: University of Chicago Press. BookGoogle Scholar
- Levendusky, M. (2009). The partisan sort: How liberals became democrats and conservatives became republicans. Chicago, IL: University of Chicago Press. BookGoogle Scholar
- Lubbers, M., & Scheepers, P. (2002). French front National voting: A micro and macro perspective. Ethnic and Racial Studies,25(1), 120–149. ArticleGoogle Scholar
- Lucassen, G., & Lubbers, M. (2012). Who fears what? Explaining far-right-wing preference in Europe by distinguishing perceived cultural and economic ethnic threats. Comparative Political Studies,45(5), 547–574. ArticleGoogle Scholar
- Mansbridge, J. J. (1986). Why we lost the ERA. Chicago, IL: University of Chicago Press. BookGoogle Scholar
- McDermott, M. L. (1997). Voting cues in low-information elections: Candidate gender as a social information variable in contemporary United States Elections. American Journal of Political Science,41(1), 270–283. ArticleGoogle Scholar
- McDermott, M. L. (1998). Race and gender cues in low-information elections. Political Research Quarterly,51(4), 895–918. ArticleGoogle Scholar
- Mendelberg, T., & Karpowitz, C. F. (2016). Power, gender, and group discussion. Political Psychology,37, 23–60. ArticleGoogle Scholar
- Mendez, J. M., & Osborn, T. (2010). Gender and the perception of knowledge in political discussion. Political Research Quarterly,63(2), 269–279. ArticleGoogle Scholar
- Milyo, J., & Schosberg, S. (2000). Gender bias and selection bias in house elections. Public Choice,105(1/2), 41–59. ArticleGoogle Scholar
- Nicholson, S. P. (2011). Dominating cues and the limits of elite influence. Journal of Politics,73(4), 1165–1177. ArticleGoogle Scholar
- Niederle, M., & Vesterlund, L. (2007). Do women shy away from competition? Do men compete too much? The Quarterly Journal of Economics,122(3), 1067–1101. ArticleGoogle Scholar
- Niven, D. (2006). Throwing your hat out of the ring: Negative recruitment and the gender imbalance in State Legislative Candidacy. Politics and Gender,2(4), 473–489. Google Scholar
- O’Brien, D. Z. (2018). Righting conventional wisdom: Women and right parties in established democracies. Politics & Gender,14(1), 27–55. ArticleGoogle Scholar
- O’Brien, D. Z., & Rickne, J. (2016). Gender quotas and women’s political leadership. American Political Science Review,110(1), 112–126. ArticleGoogle Scholar
- Ondercin, H., & Welch, S. (2009). Comparing predictors of women’s congressional election success: Candidates, primaries, and the general election. American Politics Research,37(4), 593–613. ArticleGoogle Scholar
- Ondercin, H. L., & Fulton, S. A. (2019). Bargain shopping: How candidate sex lowers the cost of voting. Politics & Gender. 1–27.
- Ono, Y., & Burden, B. C. (2019). The contingent effects of candidate sex on voter choice. Political Behavior,41(3), 583–607. ArticleGoogle Scholar
- Palmer, B., & Simon, D. (2006). Breaking the political glass ceiling. New York: Routledge. Google Scholar
- Payton, M. E., Greenstone, M. H., & Schenker, N. (2003). Overlapping confidence intervals or standard error intervals: What do they mean in terms of statistical significance? Journal of Insect Science,3(1), 34. ArticleGoogle Scholar
- Pearson, K., & McGhee, E. (2013). What it takes to win: Questioning “gender neutral” outcomes in U.S. house elections. Politics & Gender,9(4), 439–462. ArticleGoogle Scholar
- Peterson, E. (2017). The role of the information environment in partisan voting. Journal of Politics,79(4), 1191–1204. ArticleGoogle Scholar
- Popkin, S. L. (1991). The reasoning voter: communication and persuasion in presidential campaigns. Chicago, IL: University of Chicago Press. BookGoogle Scholar
- Rahn, W. M. (1993). The role of partisan stereotypes in information-processing about political candidates. American Journal of Political Science,37(2), 472–496. ArticleGoogle Scholar
- Sanbonmatsu, K. (2002a). Democrats/republicans and the politics of women’s place. Ann Arbor: University of Michigan Press. BookGoogle Scholar
- Sanbonmatsu, K. (2002b). Gender stereotypes and vote choice. American Journal of Political Science,46(1), 20–34. ArticleGoogle Scholar
- Schaffner, B., & Ansolabehere, S. (2015). CCES common content, 2014. https://doi.org/10.7910/DVN/XFXJVY, Harvard Dataverse, V4, UNF:6:WvvlTX+E+iNraxwbaWNVdg== [fileUNF].
- Schaffner, B., Ansolabehere, S., & Luks, S. (2019). CCES common content, 2018. https://doi.org/10.7910/DVN/ZSBZ7K, Harvard Dataverse, V5, UNF:6:hFVU8vQ/SLTMUXPgmUw3JQ== [fileUNF].
- Schaffner, B. F., Macwilliams, M., & Nteta, T. (2018). Understanding white polarization in the 2016 vote for president: the sobering role of racism and sexism. Political Science Quarterly,133(1), 9–34. ArticleGoogle Scholar
- Schneider, M. C., & Bos, A. (2016). The interplay of candidate party and gender in evaluations of political candidates. Journal of Women Politics and Policy,37(3), 274–294. ArticleGoogle Scholar
- Schreiber, R. (2008). Righting feminism: Conservative women and american politics. Oxford: Oxford University Press. BookGoogle Scholar
- Seltzer, R., Newman, J., & Leighton, M. V. (1997). Sex as a political variable: Women as candidates and voters in US elections. Boulder, CO: Lynn Reinner. Google Scholar
- Shames, S. L. (2018). Higher hurdles for republican women: Ideology, inattention, infrastructure. In M. Och & S. L. Shames (Eds.), The right women: Republican party activists, candidates and legislators. Santa Barbara: Praeger Press. Google Scholar
- Swers, M. (2018). From the republican revolution to the tea party wave: Republican women and the politics of women’s issues. In M. Och & S. L. Shames (Eds.), The Right women: Republican party activists, candidates and legislators. Santa Barbara: Praeger Press. Google Scholar
- Swim, J. K., Aikin, K. J., Hall, W. S., & Hunter, B. A. (1995). Sexism and racism: Old fashioned and modern prejudices. Journal of Personality and Social Psychology,68(2), 199–214. ArticleGoogle Scholar
- Thomsen, D. M. (2018). Republican women, then and now: Ideological changes in congressional candidates from 1980 to 2012. In M. Och & S. L. Shames (Eds.), The right women: Republican party activists, candidates and legislators. Santa Barbara: Praeger Press. Google Scholar
- Uhlander, C. J., & Schlozman, K. L. (1986). Candidate gender and congressional campaign receipts. Journal of Politics,48(1), 30–50. ArticleGoogle Scholar
- Valdini, M. E. (2019). The inclusion calculation: Why men appropriate women’s representation. Oxford: Oxford University Press. BookGoogle Scholar
- Volden, C., Wiseman, A. E., & Wittmer, D. E. (2013). When are women more effective lawmakers than men? American Journal of Political Science,57(2), 326–341. ArticleGoogle Scholar
- Wolbrecht, C. (2000). The politics of women’s rights: Parties. Positions and Change: Princeton University Press. Google Scholar
Author information
Authors and Affiliations
- Department of Political Science, Texas A&M University, 2936 Research Parkway, College Station, TX, 77845, USA Sarah A. Fulton & Kostanca Dhima
- Sarah A. Fulton
